Image

PyTorchでアヤメの分類を通してディープラーニングを学習しよう!!アヤメのデータ準備まで

PythonのPyTorchにを用いてディープラーニングを学びましょう。今回はアヤメの分類をするためにアヤメのデータを準備しました。PyTorchのデータフレームにアヤメのデータをセットするまでの内容です。

PyTorchでアヤメの分類をやってみよう

今回はアヤメの分類を行うためにデータセットとアヤメのデータ準備までを行います。

目次   

01. ニューラルネットワークとは

02. アヤメの分類とは

03. アヤメの分類の流れ

04. アヤメのデータセット

05. データの前準備

06. まとめ


01. ニューラルネットワークとは
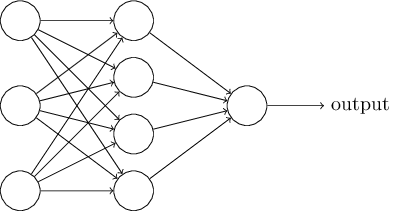


ニューラルネットワークのイメージ


ニューラルネットワークとは機械学習の1つです。

人間の脳神経回路をモデルにして人間のような学習の実現を目指します

人の脳では、ニューロンと呼ばれる神経細胞が繋がりあって脳神経回路を構築します。

脳神経回路では、電気信号がどのように脳神経回路を流れるかによって情報が何であったか脳は認識しています。

機械学習におけるニューラルネットワークでも、同じようなイメージをして問題ありません


ニューラルネットワークの最も単純なモデル単純パーセプトロンと言います。

これは入力を受け取るいくつかの入力層1つの出力層構成されています。

ちょうど上にある画像の真ん中にある中間層を除いたものです。

出力層には、入力層で受け取った情報を重要度に応じてパラメータを調整したものが送られます。

パラメータとは重みであり、その重みはいわば情報の重要度であるとイメージしています。

送られてきた情報を基に、活性化関数を使用して出力する値を調節します。


ニューラルネットワークを多層にしたモデルを、ディープニューラルネットワークといいます。

このディープニューラルネットワークを利用して対象を自ら学習させる方法を、ディープラーニングといいます。

私たちは、ディープラーニングにおいてディープニューラルネットワークのパラメータを最適化するという作業をメインで行います。


02. アヤメの分類とは


アヤメの分類とは、花である何種類かのアヤメの特徴を学習させどの種類に属するか予測させるというものです。

実際に基本的なディープラーニングの例です。

アヤメの分類のやり方を学んで、ディープラーニングの基本的なやり方押さえましょう


03. アヤメの分類の流れ


必要なライブラリーやパッケージをインポート

データの前処理

訓練データテストデータの作成

ニューラルネットワークの定義

損失関数最適化関数定義

学習

結果


04. アヤメのデータセット


Pythonの機械学習ライブラリのscimitar-learnからアヤメのデータを取ってきます。


## 上から順に行って下さい
pip install scikit_learn
## スクリプト
from sklearn.datasets import load_iris
iris = load_iris()
print(iris.DESCR)


アヤメのデータセットの説明はDESCRiptionメソッドで確認することができます。

アヤメ属に属するセトサパージカラーバージニカ3つの品種と4つの特徴量が収められていることが分かります。

150本分のアヤメのデータがあり、それぞれのアヤメに対して、がくの長さがくの幅花びらの長さ花びらの幅の4つの特徴量があります。


## 実行結果
.. _iris_dataset:
Iris plants dataset

--------------------

**Data Set Characteristics:**

:Number of Instances: 150 (50 in each of three classes)
:Number of Attributes: 4 numeric, predictive attributes and the class
:Attribute Information:

- sepal length in cm
- sepal width in cm
- petal length in cm
- petal width in cm

- class:
- Iris-Setosa
- Iris-Versicolour
- Iris-Virginica

:Summary Statistics:

============== ==== ==== ======= ===== ====================
Min Max Mean SD Class Correlation
============== ==== ==== ======= ===== ====================
sepal length: 4.3 7.9 5.84 0.83 0.7826
sepal width: 2.0 4.4 3.05 0.43 -0.4194
petal length: 1.0 6.9 3.76 1.76 0.9490 (high!)
petal width: 0.1 2.5 1.20 0.76 0.9565 (high!)
============== ==== ==== ======= ===== ====================

:Missing Attribute Values: None
:Class Distribution: 33.3% for each of 3 classes.
:Creator: R.A. Fisher
:Donor: Michael Marshall (MARSHALL%PLU@io.arc.nasa.gov)
:Date: July, 1988

The famous Iris database, first used by Sir R.A. Fisher. The dataset is taken
from Fisher's paper. Note that it's the same as in R, but not as in the UCI
Machine Learning Repository, which has two wrong data points.
This is perhaps the best known database to be found in the
pattern recognition literature. Fisher's paper is a classic in the field and
is referenced frequently to this day. (See Duda & Hart, for example.) The
data set contains 3 classes of 50 instances each, where each class refers to a
type of iris plant. One class is linearly separable from the other 2; the
latter are NOT linearly separable from each other.

.. topic:: References
- Fisher, R.A. "The use of multiple measurements in taxonomic problems"
Annual Eugenics, 7, Part II, 179-188 (1936); also in "Contributions to
Mathematical Statistics" (John Wiley, NY, 1950).
- Duda, R.O., & Hart, P.E. (1973) Pattern Classification and Scene Analysis.
(Q327.D83) John Wiley & Sons. ISBN 0-471-22361-1. See page 218.
- Dasarathy, B.V. (1980) "Nosing Around the Neighborhood: A New System
Structure and Classification Rule for Recognition in Partially Exposed
Environments". IEEE Transactions on Pattern Analysis and Machine
Intelligence, Vol. PAMI-2, No. 1, 67-71.
- Gates, G.W. (1972) "The Reduced Nearest Neighbor Rule". IEEE Transactions
on Information Theory, May 1972, 431-433.
- See also: 1988 MLC Proceedings, 54-64. Cheeseman et al"s AUTOCLASS II
conceptual clustering system finds 3 classes in the data.
- Many, many more ...


printを実行するとアヤメのデータが上記のようにして表示されます

次にpandasというPythonのライブラリーを使用します。


## pandas
import pandas as pd
df = pd.DataFrame(iris.data, columns=iris.feature_names)
print(df.head())


データフレーム型に変換します。

第1引数にはアヤメの数値データを入れます。

第2引数の列名columnsにはアヤメの特徴量名iris.feature_namesを渡します。

データセットの中身を確認するにはdf.head()とすることで上位5件のみを表示できます。


## アヤメのデータ
df['Variety'] = iris.target
df.loc[df['Variety'] == 0, 'Variety'] = 'setosa'
df.loc[df['Variety'] == 1, 'Variety'] = 'versicolor'
df.loc[df['Variety'] == 2, 'Variety'] = 'virginica'
## 出力
print(df.head())
## 実行結果
sepal length (cm) sepal width (cm) ... petal width (cm) Variety
0 5.1 3.5 ... 0.2 setosa
1 4.9 3.0 ... 0.2 setosa
2 4.7 3.2 ... 0.2 setosa
3 4.6 3.1 ... 0.2 setosa
4 5.0 3.6 ... 0.2 setosa
## 出力
print(df.describe())
## 実行結果
sepal length (cm) ... petal width (cm)
count 150.000000 ... 150.000000
mean 5.843333 ... 1.199333
std 0.828066 ... 0.762238
min 4.300000 ... 0.100000
25% 5.100000 ... 0.300000
50% 5.800000 ... 1.300000
75% 6.400000 ... 1.800000
max 7.900000 ... 2.500000


print(df.describe())基本統計量を確認することができます。


## seabornのインストール
pip install seaborn


データを可視化して見やすくしましょう。

seabornというライブラリーはデータの特徴などを可視化してデータを見やすくしてくれます。

ペアプロットsns.pairplotを使用して図示しました。


## データの特徴などを可視化するためのライブラリ
## グラフ化
import seaborn as sns
import matplotlib.pyplot as plt
sns.pairplot(df, hue='Variety')
plt.show()


05. データの前準備


## データの前準備
import pandas as pd
import matplotlib.pyplot as plt
from sklearn.datasets import load_iris
from sklearn.model_selection import train_test_split
import torch
from torch.utils.data import TensorDataset, DataLoader
from torch import nn
import torch.nn.functional as F
from torch import optim

iris = load_iris()
data = iris.data
label = iris.target


06. まとめ


お疲れ様でした。

ここまで読んでいただきありがとうございました。

今回はデータセットまでを行いました。

PyTorchプログラミング入門を利用しながら実際に今回もやってみました。

まずは基本を押さえます。

次回はアヤメの分類までを行います。

アヤメの分類まではインターネット上で公開されています。